Troubleshooting with DevTools
Introduction
This page is intended to help you gather data to help us troubleshoot issues you may encounter while using Tealstreet. If you are experiencing problems, please follow the steps below to assist in diagnosing and resolving the issue.
Joining our Discord community is also a great way to get help and support from other users and the Tealstreet team more quickly.
Accessing the Developer Tools console
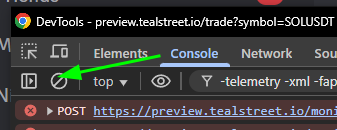
On your keyboard press F12 or Ctrl + Shift + I (or Cmd + Option + I on Mac) to open the Developer Tools.
-
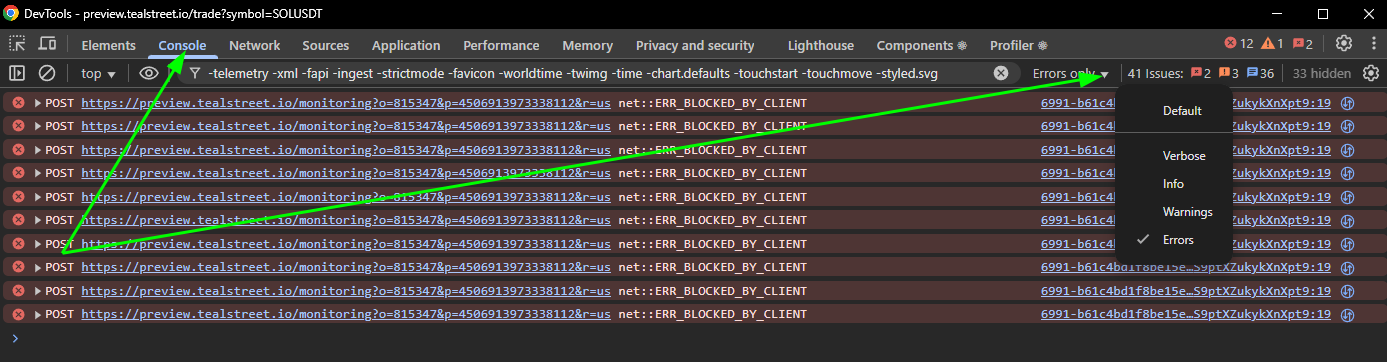
Once you have the Developer Tools open, click on the 'Console' tab. This will allow you to see any errors or warnings that may be occurring in the application.
-
On the right hand side of the Developer Tools top-bar you can change the verbosity of the console output. Set it to 'Errors' to see the most relevant information. * You can also set it to 'Verbose' to see all output, but this may be overwhelming if you are not familiar with the application. In most circumstances Errors and Warnings should be sufficient.
-
Once you have selected the console and changed the verbosity, you can click the circle with a line through it to clear the console output.
-
Now try to reproduce the issue you are experiencing. This will allow you to see any errors or warnings that may be occurring
-
If you see any errors or warnings in the console, please take a screenshot of the console output and include it in your message to us. This will help us diagnose the issue more quickly.
- Tools like Flameshot and Greenshot can be useful to take screenshots of the console output. Snipping tool on Windows and Shift + Cmd + 4 on Mac can also be used to take screenshots.
- You can also record a video of your screen such as with Screen2Gif or OBS Studio to show us the issue you are experiencing.
-
You can also right click on the console output and select 'Save as...' to save the console output to a file. This can be useful if you have a lot of output and want to share it with us.
Investigating the network requests
-
In the Developer Tools, click on the 'Network' tab. This will allow you to see all the network requests that are being made by the application.
-
Once you have the Network tab open, you can click the circle with a line through it to clear the network requests.
-
Now try to reproduce the issue you are experiencing. This will allow you to see any network requests that may be failing or returning errors.
-
If you see any requests that are failing or returning errors, please take a screenshot of the network requests and include it in your message to us. This will help us diagnose the issue more quickly.
- Tools like Flameshot and Greenshot can be useful to take screenshots of the console output. Snipping tool on Windows and Shift + Cmd + 4 on Mac can also be used to take screenshots.
- You can also record a video of your screen such as with Screen2Gif or OBS Studio to show us the issue you are experiencing.
In the networking screenshot you may be overwhelmed by the amount of requests that are being made. You can focus specifically on things that look like errors such as seeing a red X next to the request, or requests that have a status code of 4xx or 5xx. As an example 404 means the resource was not found, and 500 means there was an internal server error.