Depth Chart
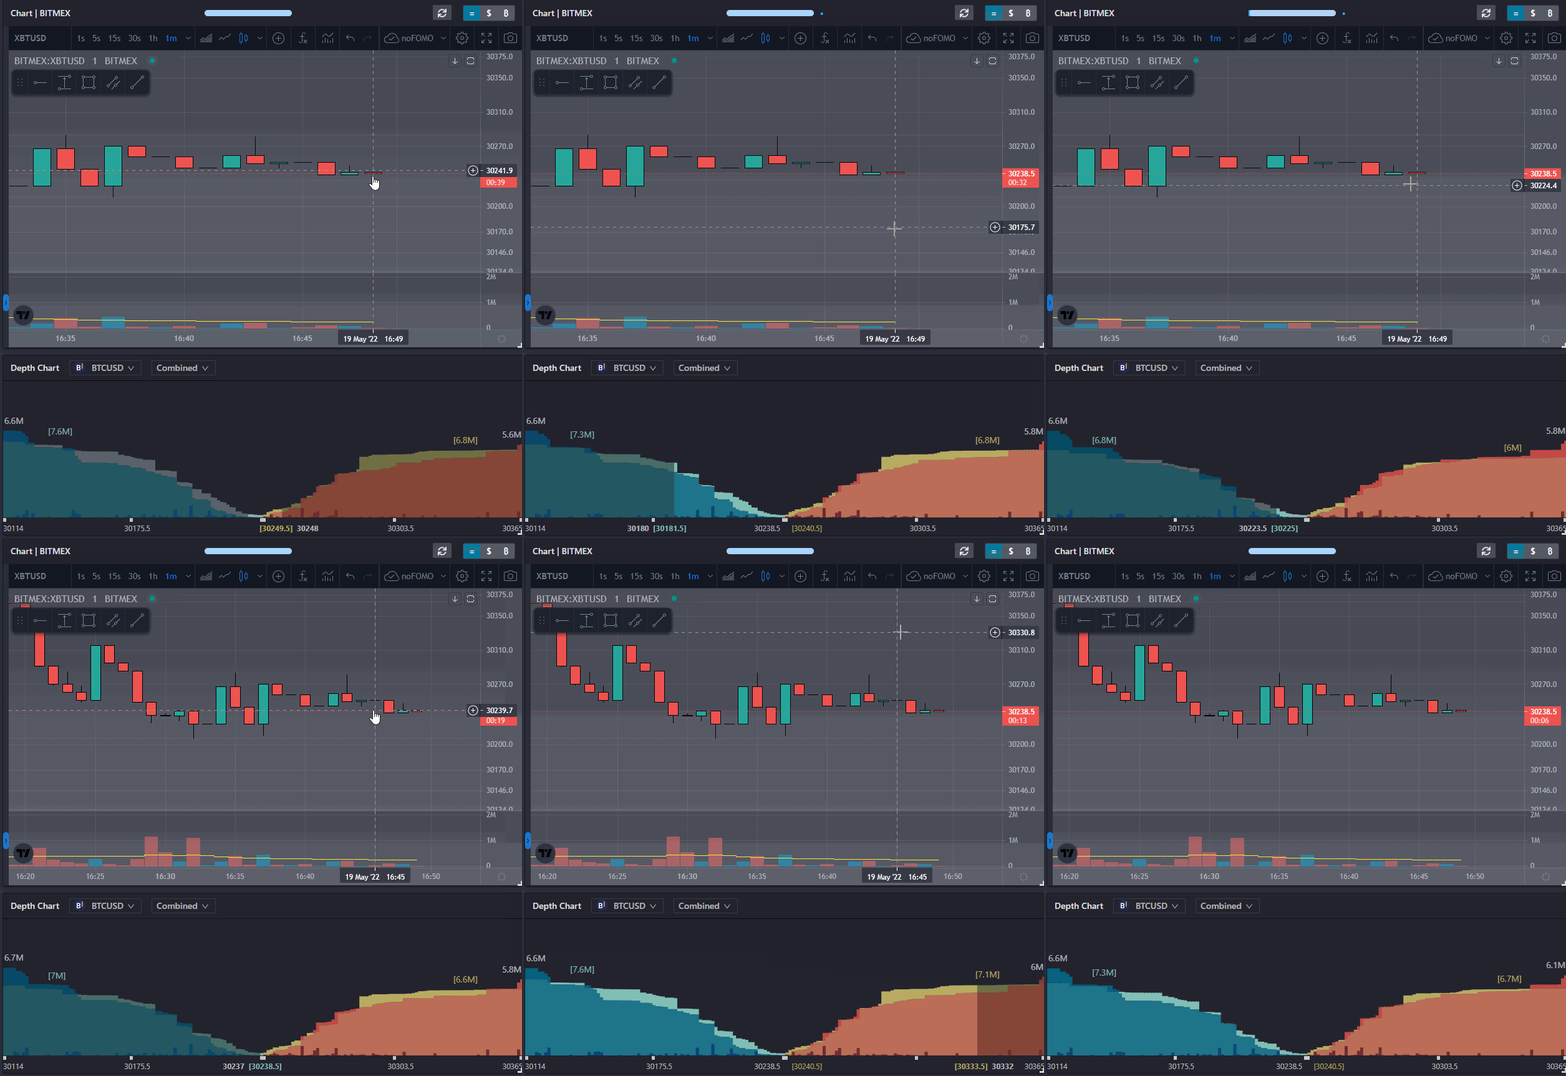
This is the Depth Chart window of Teal Street. It displays current Bids on the left and Asks on the right, in the form of a depth chart, based on your currently selected crypto and the selected exchange/API.

To adjust the range of prices, use your mouse wheel. Turning the wheel forward will decrease the spread like zooming in. Scrolling backward will increase the spread like zooming out.
View
You can change how the Depth Chart looks by selecting the different modes.

- Individual
- Cumulative
- Combined
Multiple Exchanges
A great feature of the Depth Chart is the ability to monitor multiple exchanges.

If you are connected with ByBit, select the BitMEX-XBTUSD option on the secondary market drop down menu to display an overlay of both depth charts. You will then see the depth chart with more than two colors.
Orders
Your Open Orders will also show on the Depth Chart as long as they are within the price spread. The order is indicated by a small yellow circle on the chart.

Chart Hover Depth Chart
Hovering your mouse cursor on the TradingView chart will show on Depth Chart overlay to better compare price with liquidity.
