Ticks Chart
This section will go over the Ticks Chart module
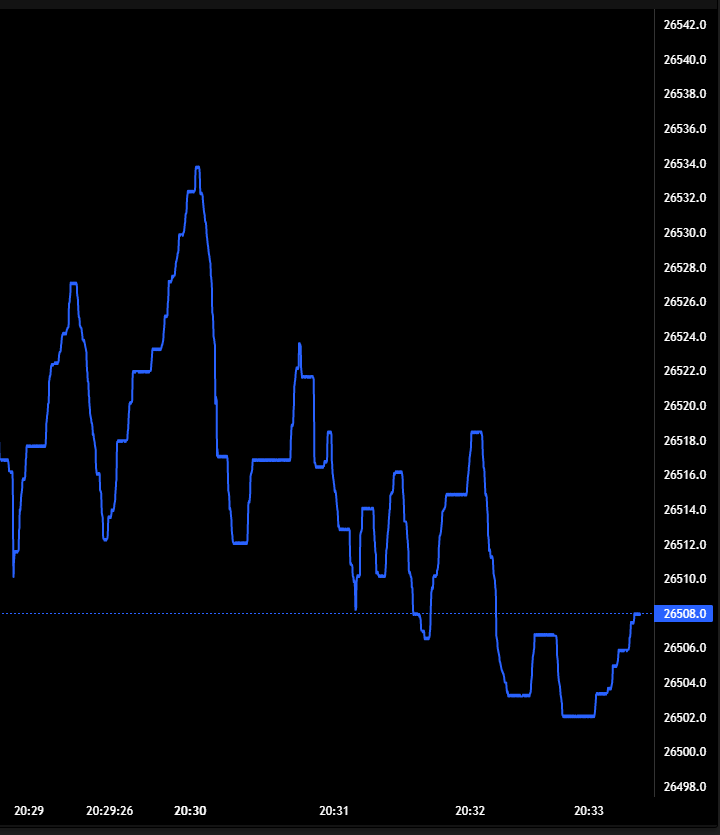
The Ticks Chart Module provides real-time visualization of individual trades as they occur on Binance Futures. This module allows you to drill down into market activity by seeing virtually every trade that happens in real-time, providing granular insight into price movements and trading activity.
Features
- Real-time Trade Data: Live connection to Binance Futures showing every trade as it happens
- Historical Context: Loads recent trade history when first connecting
- Responsive Design: Automatically adjusts to your terminal window size
- Time Precision: Shows exact timestamps for accurate trade timing
Market Support
important
The Ticks Chart module currently only supports linear Binance Futures markets.
- ✅ Supported: Linear perpetual contracts (e.g., BTCUSDT, ETHUSDT)
- ❌ Not Supported: USD-settled contracts (e.g., BTCUSD, ETHUSD)
- ❌ Not Supported: Other exchanges (Bybit, etc.)
Use Cases
Market Analysis
- Micro-pattern Recognition: Identify small price patterns and micro-trends
- Volume Analysis: Observe trading activity intensity through trade frequency
- Price Discovery: See how prices evolve through individual trades
- Market Microstructure: Understand bid-ask spread dynamics
Trading Insights
- Entry/Exit Timing: Fine-tune entry and exit points based on real-time price action
- Market Sentiment: Gauge immediate market sentiment through trade patterns
- Liquidity Assessment: Identify periods of high or low trading activity
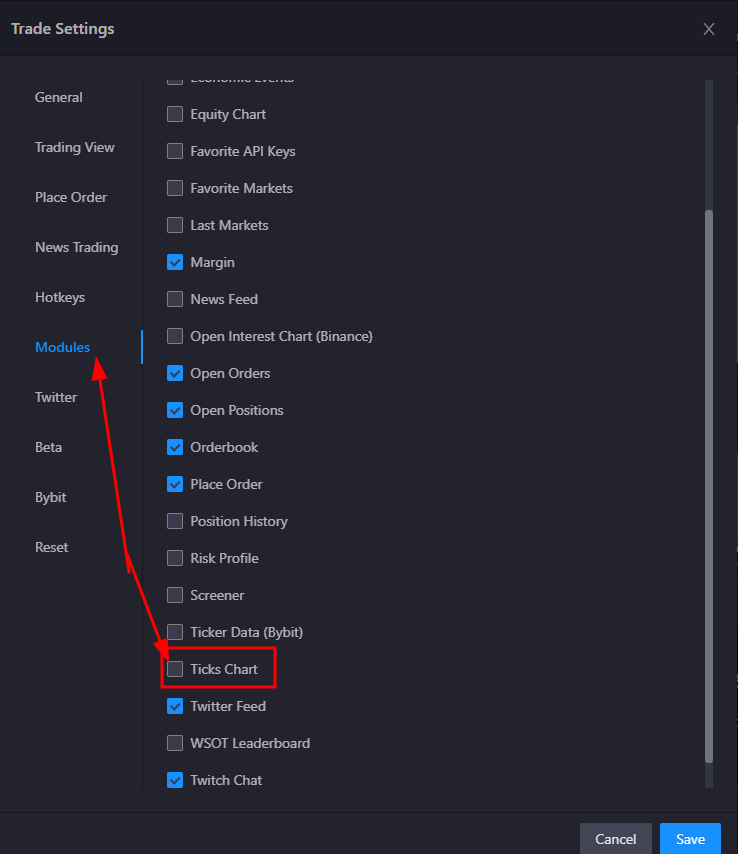
Activating the Ticks Chart module
- Activate it by going to your modules tab in the terminal settings or by clicking the module tile selector at the top right of the screen.
Limitations
note
The Ticks Chart module does not currently support trading functionality.
- Exchange Limitation: Only works with Binance Futures linear contracts
- No Trading: Cannot place trades directly from the chart
- Data Delay: Subject to network latency and Binance API response times
Troubleshooting
Common Issues
Chart not displaying data:
- Verify the symbol is a supported Binance Futures linear contract
- Ensure the symbol is active and trading
Connection issues:
- The module automatically reconnects if connection is lost
- If persistent, check if Binance Futures is accessible from your location (They may be doing geo-blocking)
Performance issues:
- The chart automatically manages data to maintain smooth performance
- Consider reducing the terminal window size if experiencing lag