Basic Charts
This section will go over the Basic Charts module of Tealstreet
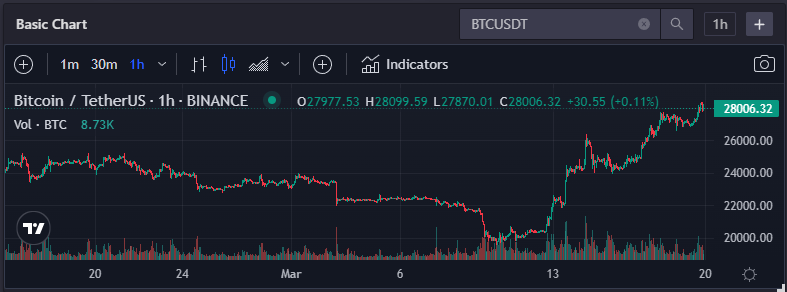
With this tool you can put any chart supported by TradingView on your terminal. The Basic Chart module provides a standalone TradingView chart widget that can display any instrument, timeframe, and technical indicators.
Functionality
- Can duplicate/remove windows with the + button at top of frame
- Top bar settings persist through refreshes
- Position & Size saved in TS workspace layout
- Custom Symbol Input: Enter any TradingView-supported symbol (e.g.,
BINANCE:BTCUSDT,NASDAQ:AAPL) - Multiple Timeframes: 1m, 3m, 5m, 15m, 30m, 1h, 2h, 3h, 4h, 1D, 1W, 1M
- Technical Indicators: 100+ indicators including RSI, MACD, Bollinger Bands, and more
- Theme Integration: Automatically matches your Tealstreet theme (Light/Dark)
- Error Recovery: Built-in error handling with automatic retry mechanism
More info
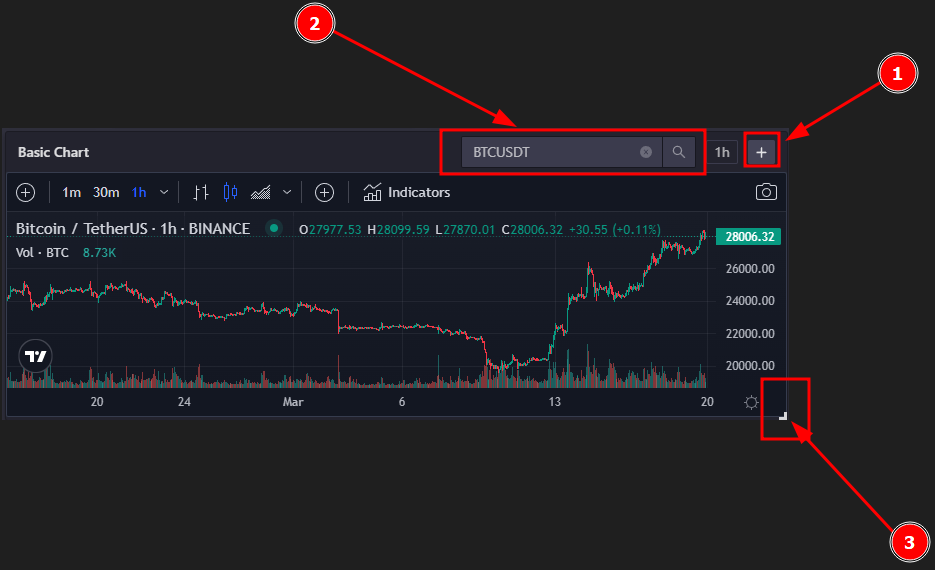
- The Plus button can be used to duplicate or remove a Basic Chart window
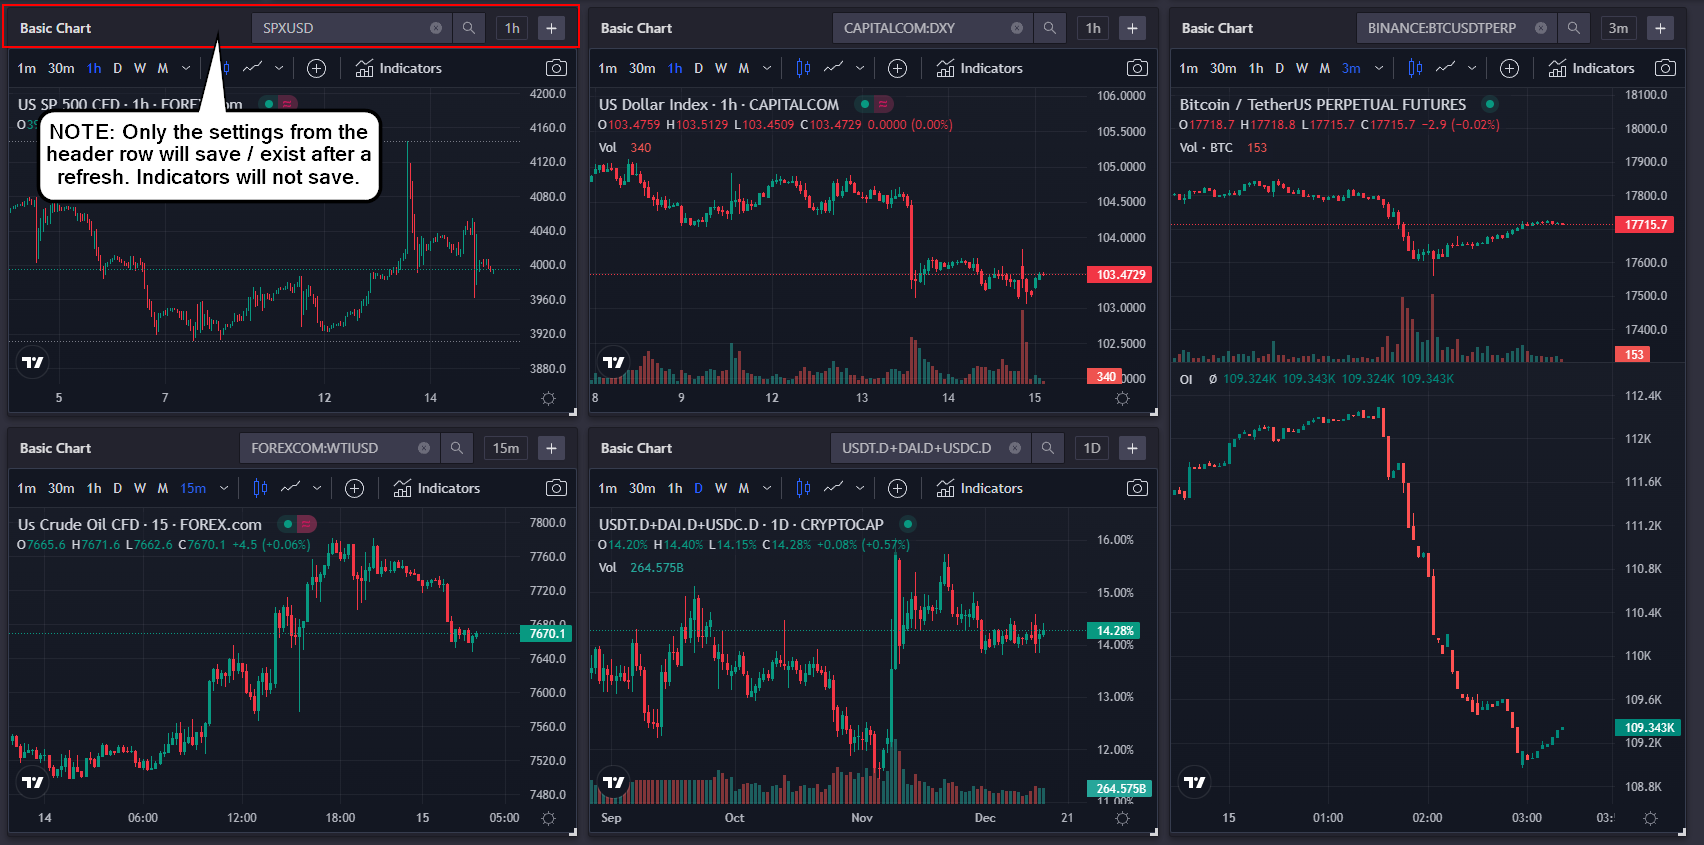
- The top header (Ticker & Timeframe) is the only section that preserves its settings across refreshes. Changes made inside the chart will not be preserved
- When the workspace is unlocked you can drag bottom corner to expand/shrink the window. These settings will be saved as part of the workspace profile that is currently active
Settings
The Basic Chart module includes several configurable settings accessible through the module settings panel:
- Show Top Bar: Toggle the TradingView top toolbar visibility
- Show Legend: Toggle the chart legend display
- Show Volume Overlay: Enable/disable volume indicator overlay on the chart
These settings are saved per tab and persist across browser refreshes.
Available Timeframes
The Basic Chart supports the following time intervals:
- 1m, 3m, 5m, 15m, 30m - Intraday timeframes
- 1h, 2h, 3h, 4h - Hourly timeframes
- 1D - Daily timeframe
- 1W - Weekly timeframe
- 1M - Monthly timeframe
Technical Indicators
The Basic Chart module supports over 100 technical indicators, including:
Popular Indicators:
- RSI (Relative Strength Index)
- MACD (Moving Average Convergence Divergence)
- Bollinger Bands
- Moving Averages (SMA, EMA, WMA, DEMA, TEMA)
- Stochastic Oscillator
- Volume indicators
- Ichimoku Cloud
- Williams %R
- ATR (Average True Range)
- VWAP (Volume Weighted Average Price)
Advanced Indicators:
- Supertrend
- Parabolic SAR
- Keltner Channels
- Donchian Channels
- Fisher Transform
- Ultimate Oscillator
- And many more...
To add indicators, use the indicators dropdown in the chart header and select from the available options.
Custom Symbols
You can display any TradingView-supported symbol by entering it in the search field. Examples:
- Crypto:
BINANCE:BTCUSDT,COINBASE:ETHUSD - Stocks:
NASDAQ:AAPL,NYSE:TSLA - Forex:
FX:EURUSD,FX:GBPJPY - Commodities:
TVC:GOLD,TVC:SILVER - Indices:
SP:SPX,NASDAQ:NDX
If no custom symbol is specified, the chart will display the currently active trading symbol.
Additional Information
Some additional information can be read about here from the blog post by Sam
The Basic Chart window is a standalone window that can be used to display a chart of any instrument on TradingView. A common use of it is to display a chart of some other instrument you are interested in such as an index or the dollar.
You will not be able to trade positions on the main chart through the basic chart.
The Basic Chart automatically adapts to your Tealstreet theme settings and provides a consistent visual experience with the rest of the application.
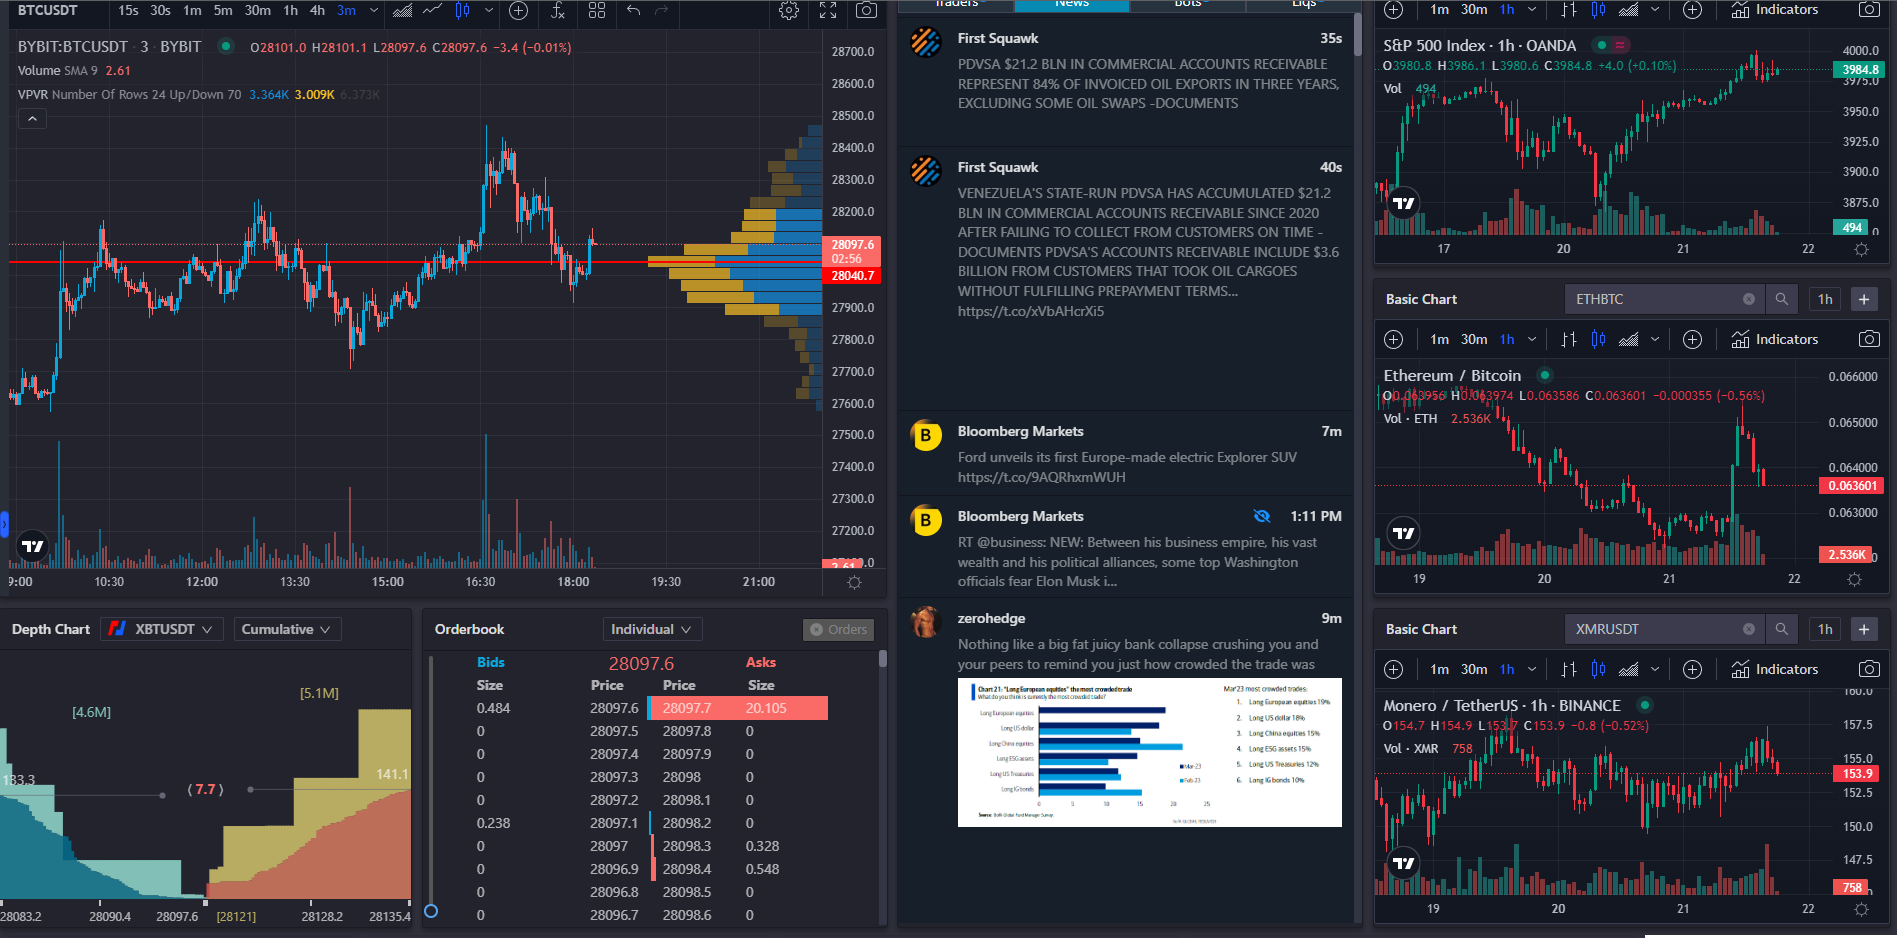
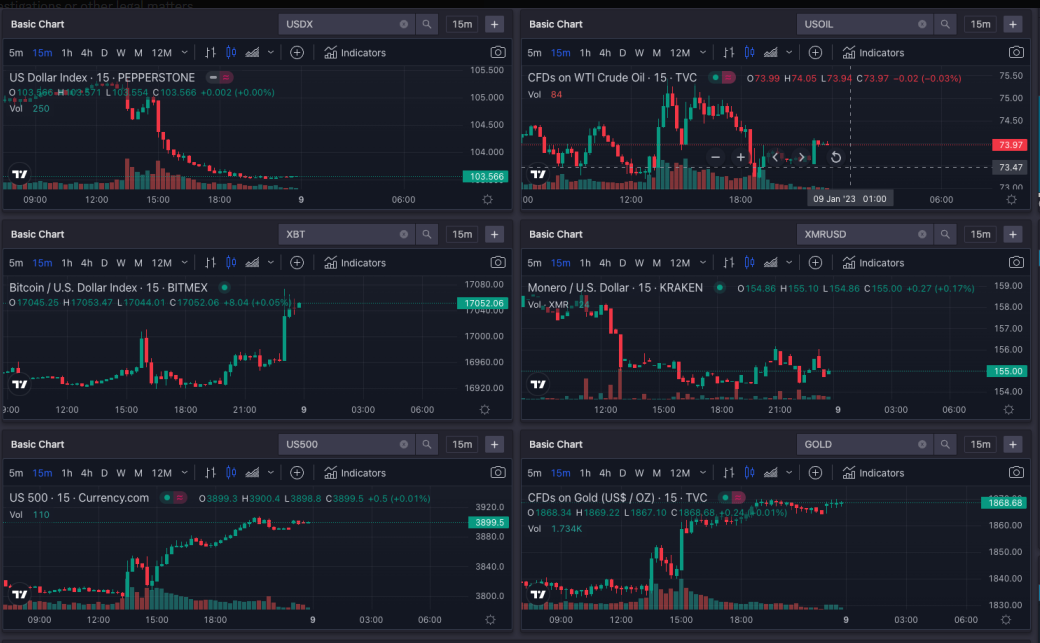
Examples
Example Layouts